2018 PHM Data Challenge
A dataset shared by Kai Goebel, updated on Dec 10, 2018
Summary
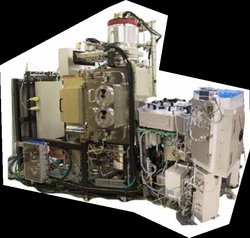
This data set examines the fault behavior of an ion mill etch tool used in a wafer manufacturing process (see references at the end of this document). The process of ion mill etching typically consists of the following steps:
- Inserting a wafer into the mill
- Configure wafer settings (rotation speed, angles, beam current / voltages, etc.)
- Processing the wafer for a set amount of time
- Repeat 2 or 3 for different steps of recipe
- Remove wafer from mill
An ion source generates ions that are accelerated through an electric field using a series of grids set at specific voltages. This creates an ion beam that travels and eventually strikes the wafer surface. Material is removed from the wafer when ions hit the wafer surface. The wafer is placed on a rotating fixture that can be tilted at different angles facing the incoming ion beam. The wafer can be shielded from the ion beam until ready for milling operation to commence using a shutter mechanism as shown in Figure 2. A Particle Beam Neutralizer (PBN) control system influences the ion beam shape / ion distribution as it travels to the wafer surface.
The wafer is cooled by a helium / water system called flowcool. The cooling system passes helium gas behind the wafer at a specified flow rate. The helium gas is indirectly cooled by a water system. The wafer and fixture o-ring separates the flowcool gas from the ion mill vacuum chamber.
Many different failure mechanisms can be present in this system including leaks between flowcool and ion mill chambers, electric grid wear, ion chamber wear, etc. It would be beneficial to predict where and when these failures occur and schedule downtime of these ion mills for maintenance operations.
The objective of this data challenge is to build a model from time series sensor data collected from various ion mill etching tools operating under various conditions and settings.
- Diagnose failures (i.e. detect and identify)
- Determine time remaining until next failure (i.e. predict remaining useful life)
Predictions of time-to-failure at a specific time should only use time-series data from current and past times. In other words, do not try to predict the point of failure first and then backtrack through time to determine time-to-failure predictions.
Source Files
|
40.9 MB | 0 downloads |
|
42.0 MB | 0 downloads |
|
33.5 MB | 0 downloads |
|
21.1 MB | 0 downloads |
|
26.0 MB | 0 downloads |
|
430.7 MB | 0 downloads |
|
385.1 MB | 0 downloads |
|
473.7 MB | 0 downloads |
|
31.6 MB | 0 downloads |
|
22.0 MB | 0 downloads |
|
33.2 MB | 0 downloads |
|
19.4 MB | 0 downloads |
|
19.5 MB | 0 downloads |
|
0 bytes | 0 downloads |
|
0 bytes | 0 downloads |
|
573.5 MB | 0 downloads |
|
585.0 MB | 0 downloads |
Support/Documentation
For any questions, contact this resource's administrator: NDC-kgoebel