RSW, AePW Results: α = 2°, Unforced System Results
Mach 0.825, Rec = 4M, Test medium: R-12
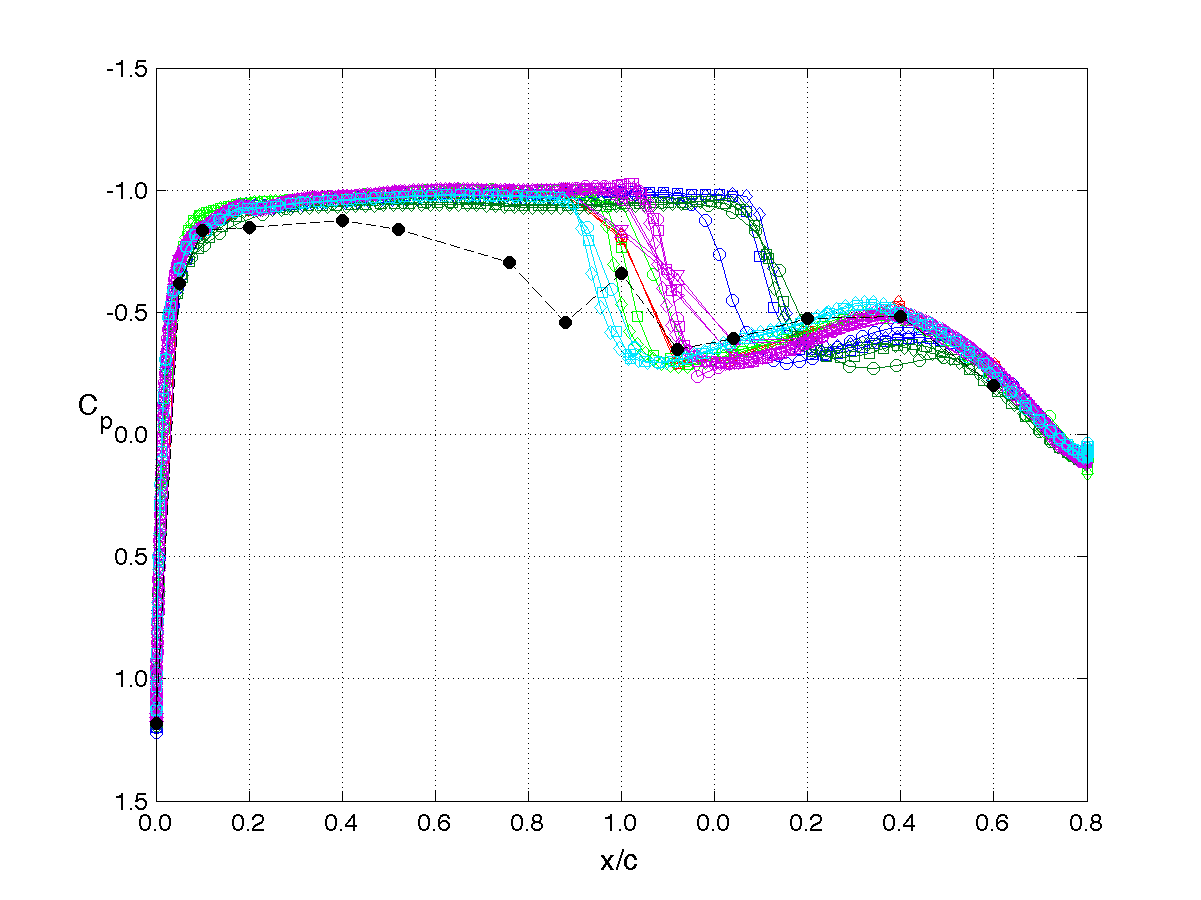
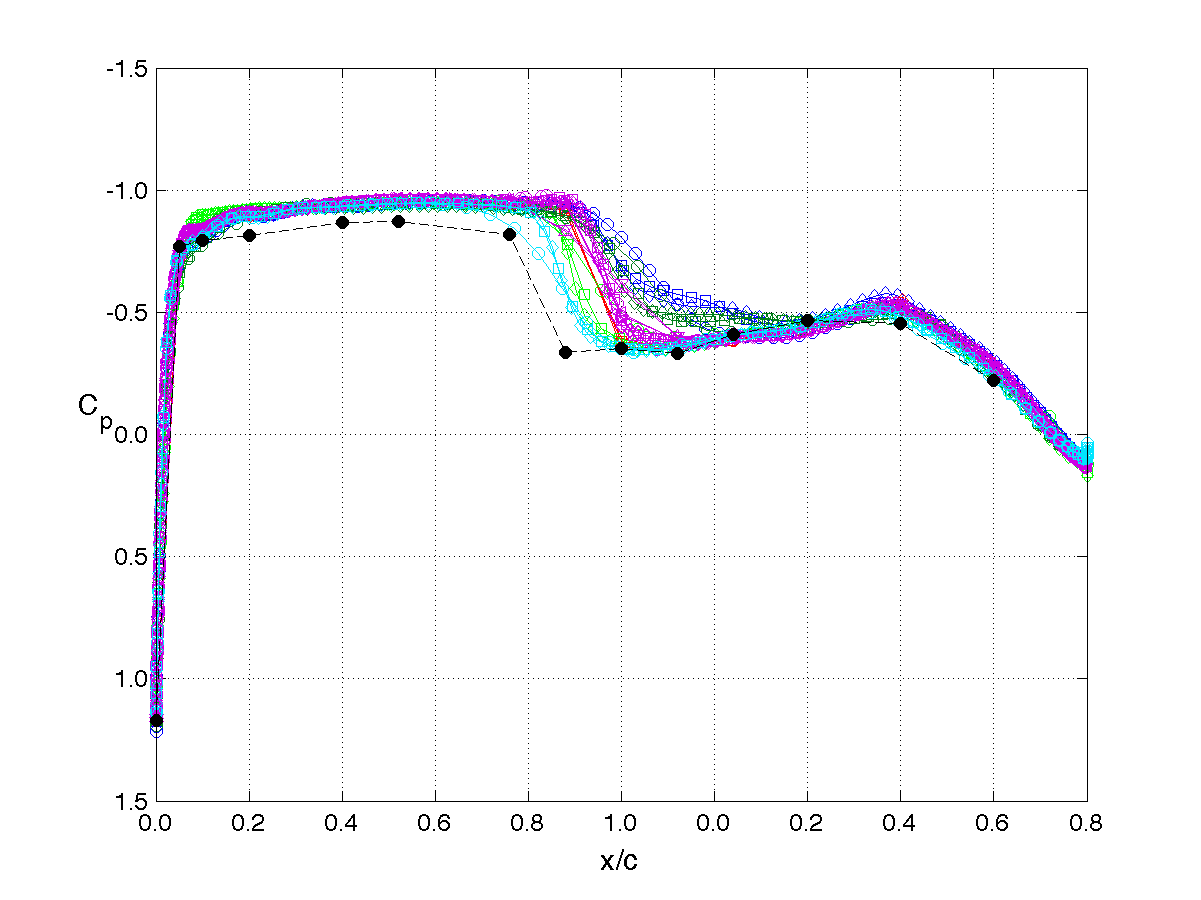
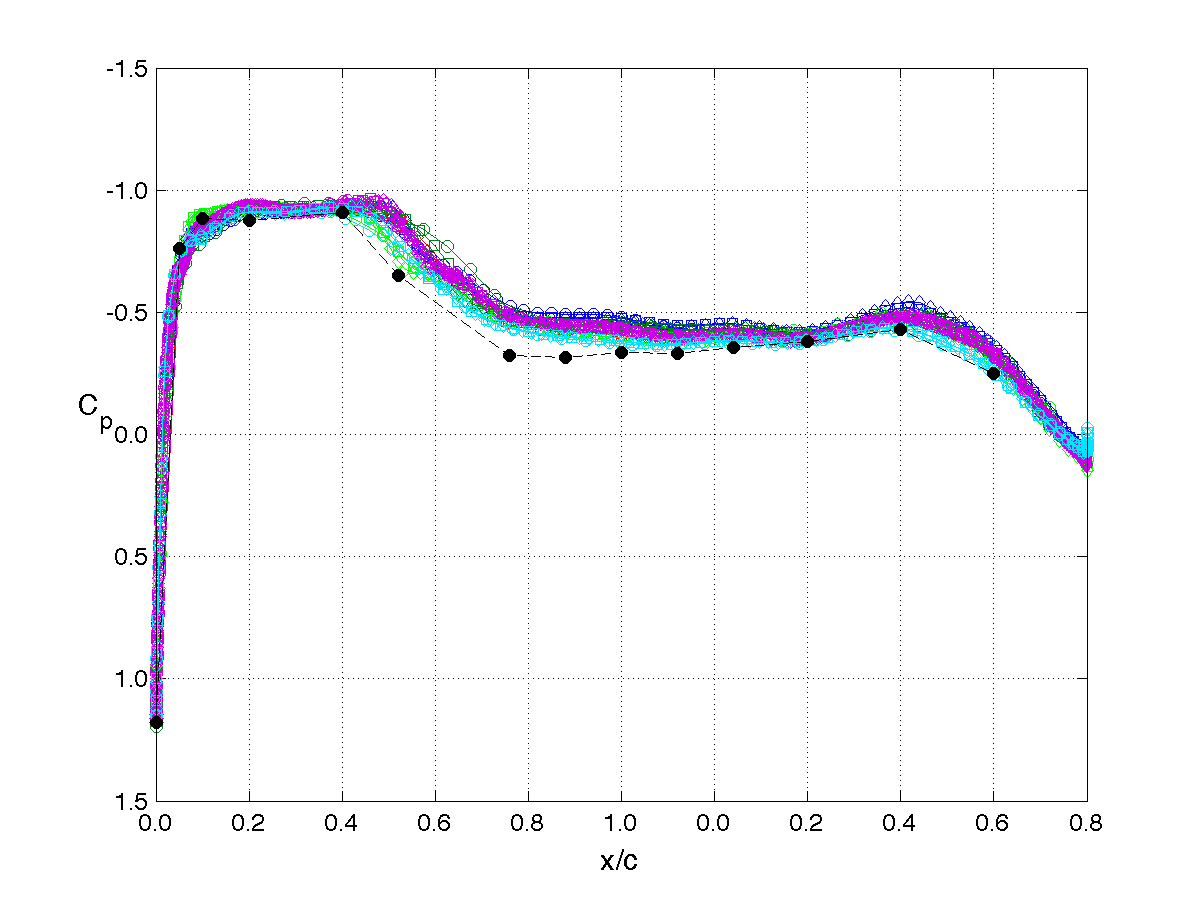
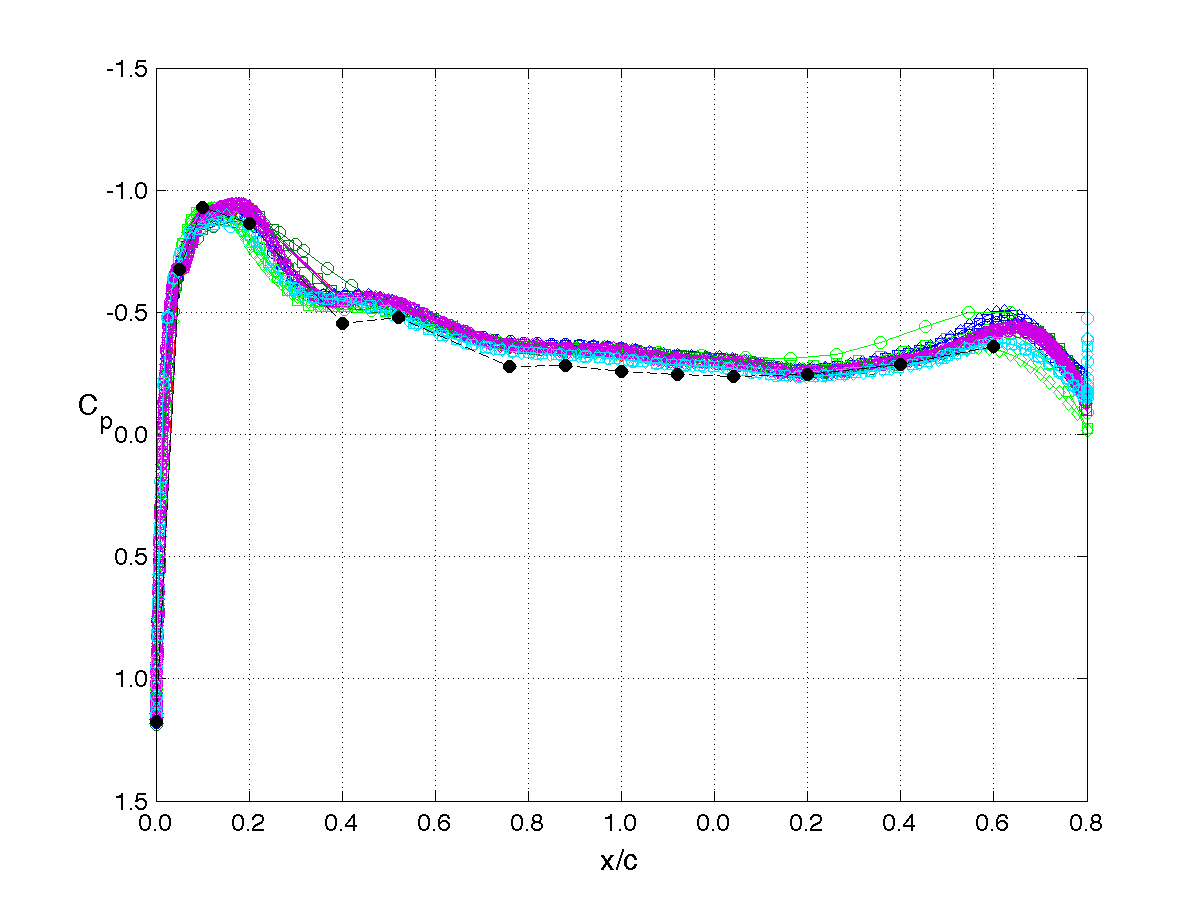
The unforced system is often referred to as the "steady" or "static" results. The results shown on this page are for the mean angle of attack condition of 2°. The legend or key for the plots is shown at the left of the table. Note that the legend changes for each analysis/test condition. (i.e. it does not apply to the results on other pages.)
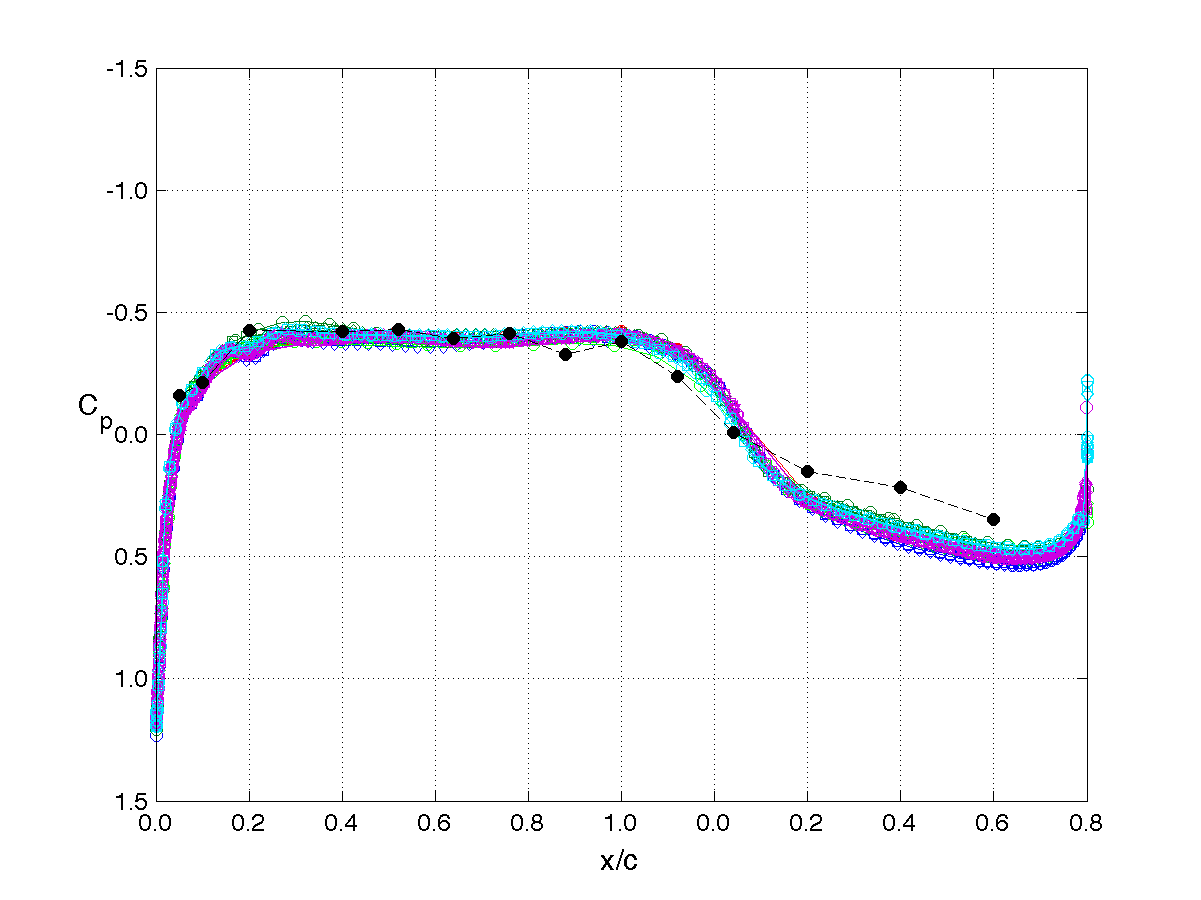
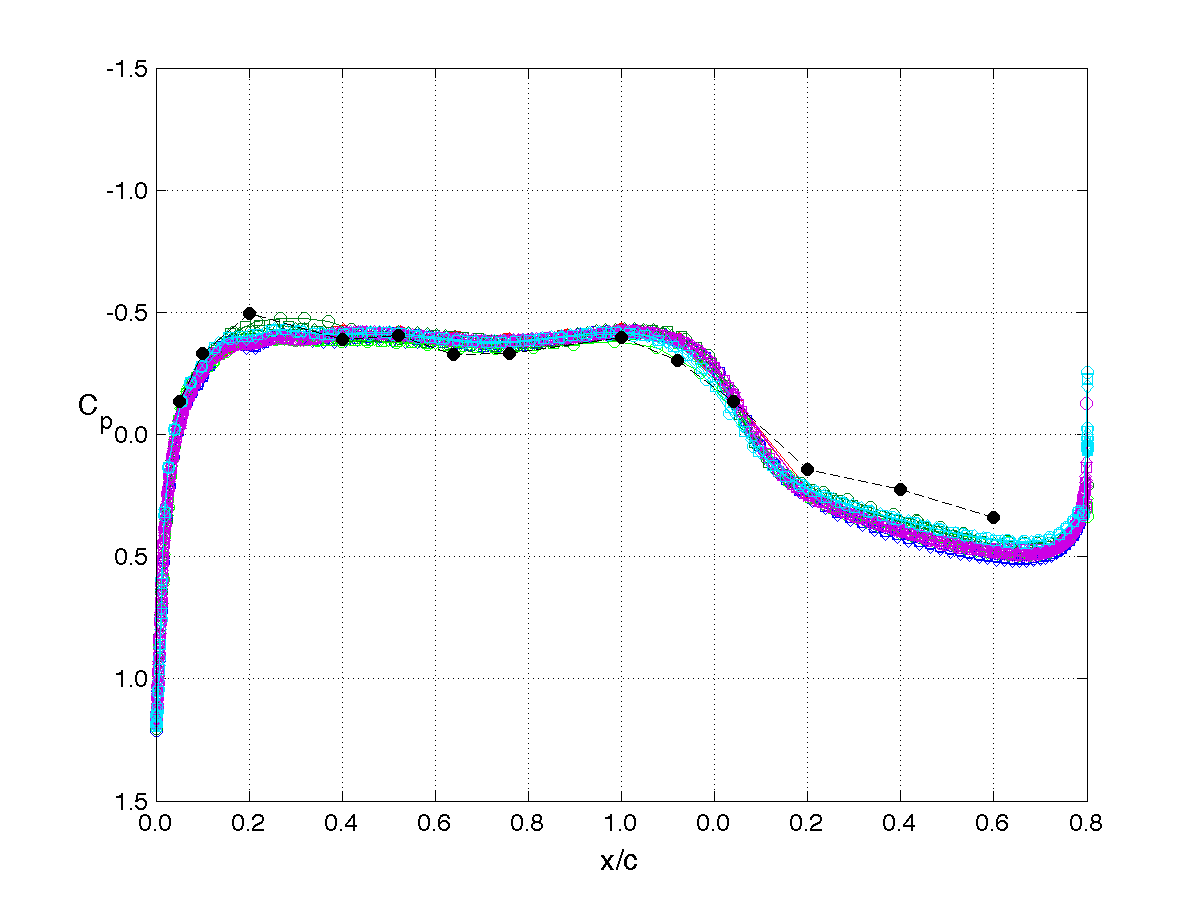
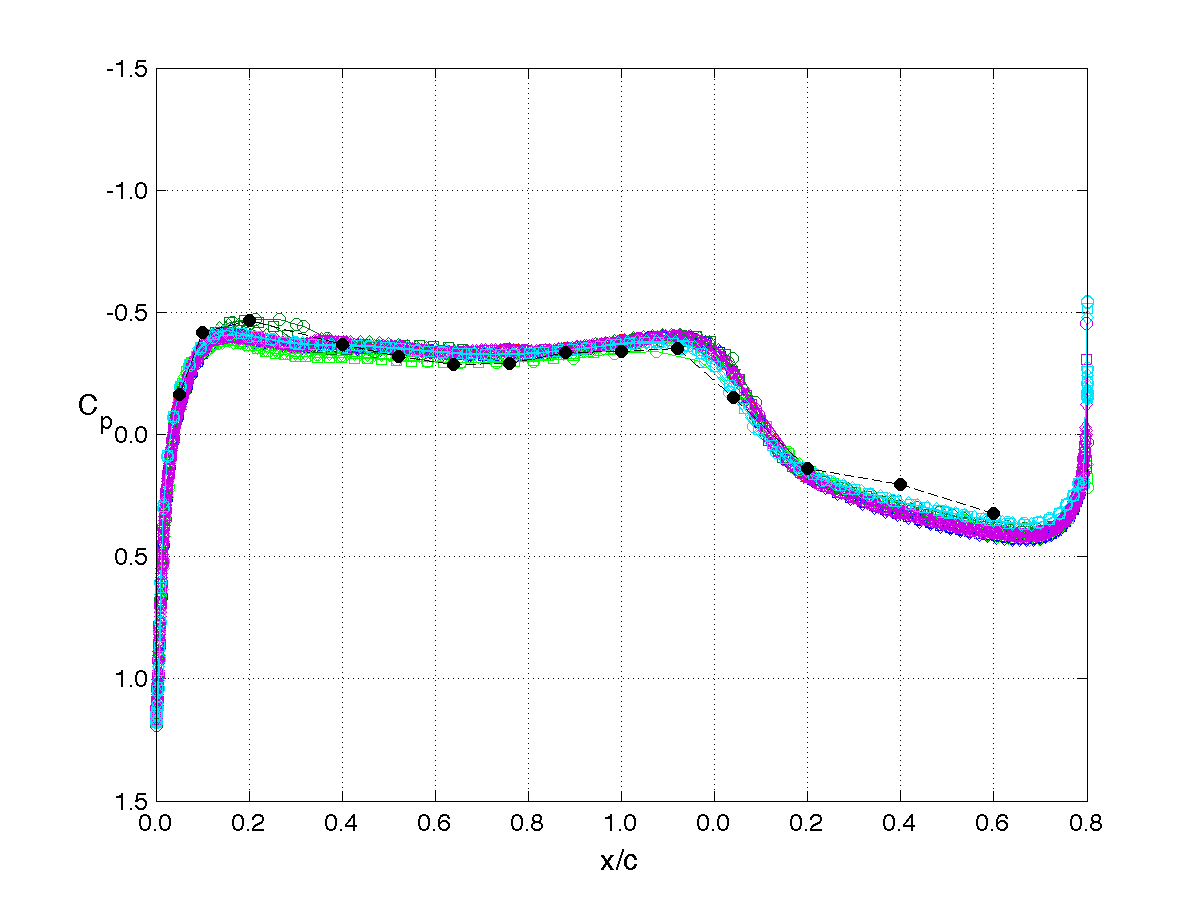
The principal comparison quantities generated from post-processing the computational outputs are the pressure coefficient distributions. Other quantities calculated include the integrated force (lift & drag) and moment (pitching moment) coefficients.
Pressure coefficient distributions

|
|

Grid Convergence, lift coefficient
The integrated loads were computed by each analyst. However, there was confusion over the integration area and the normalizing constants. This confusion is likely responsible for the scatter seen in these results, rather than something inherent in the simulations.Plotting vs grid factor, grids with more points are towards the left side of the graph (the vertical axis), and smaller grids are out to the right.
-
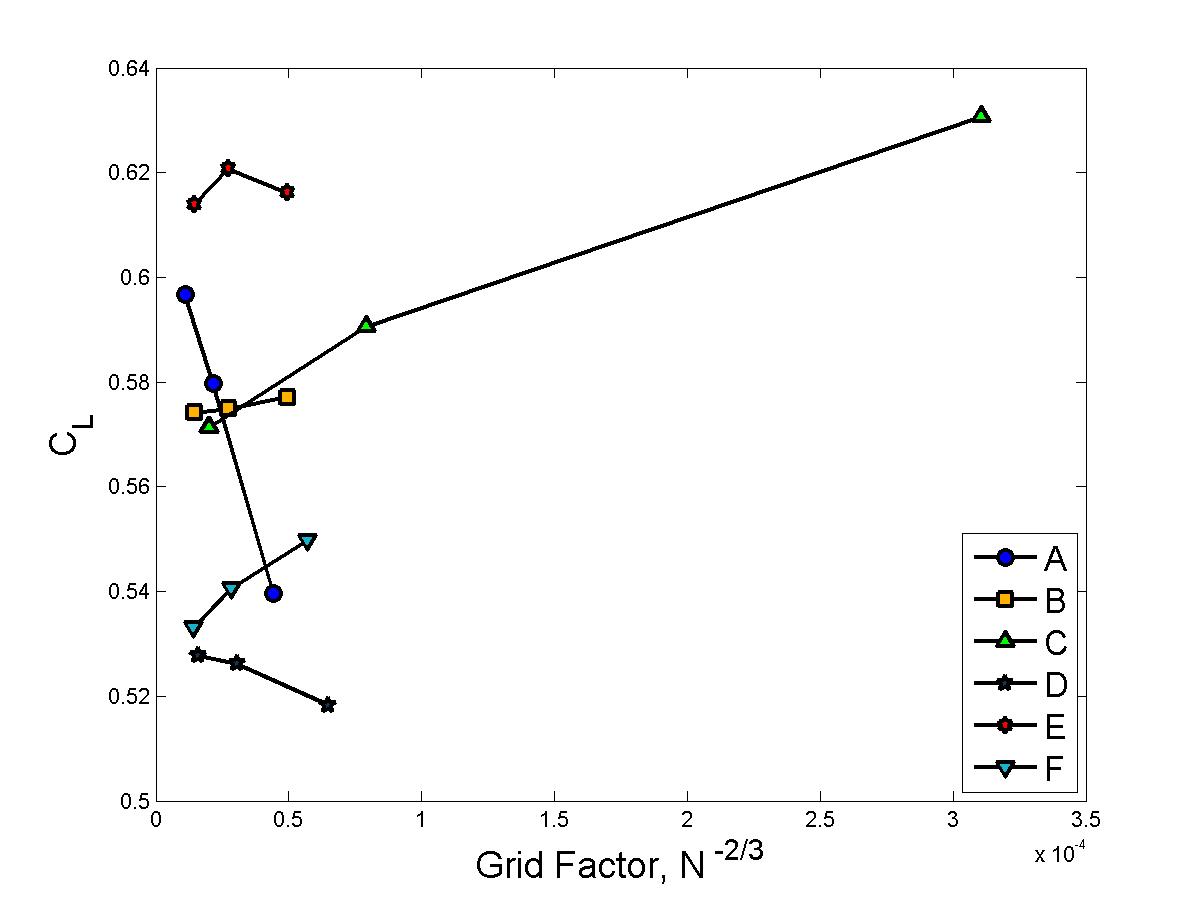
Lift Coefficient vs Grid Factor
-
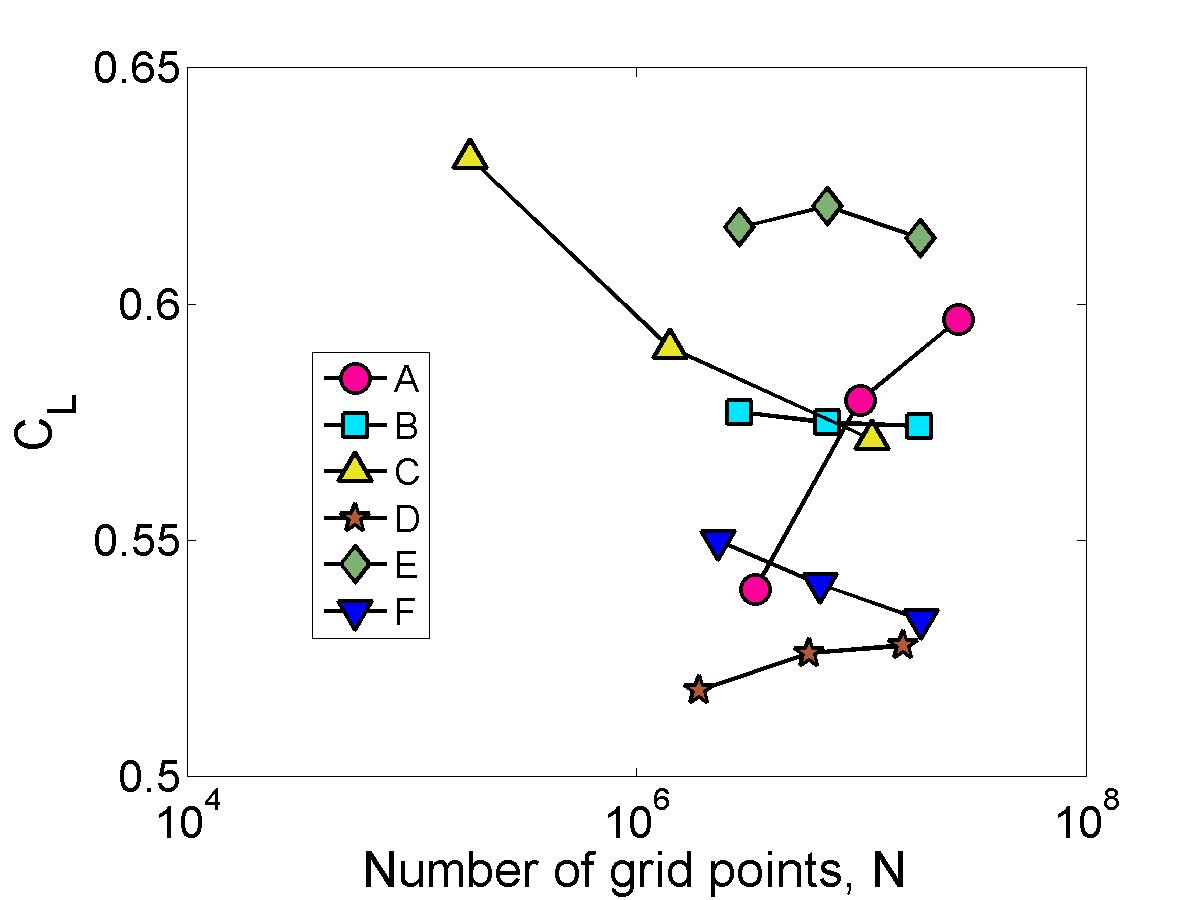
Lift Coefficient vs Number of Grid Points, log scale
-
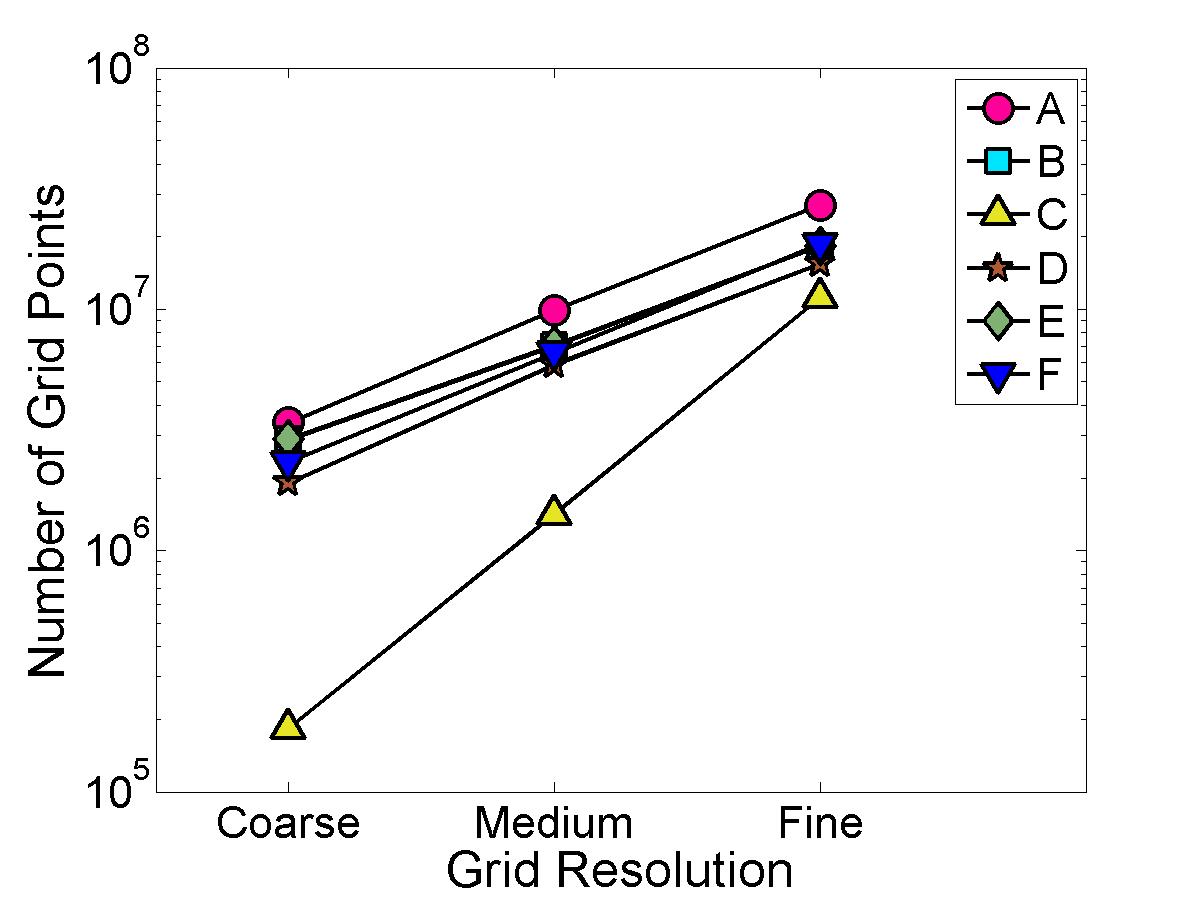
Grid Sizes used
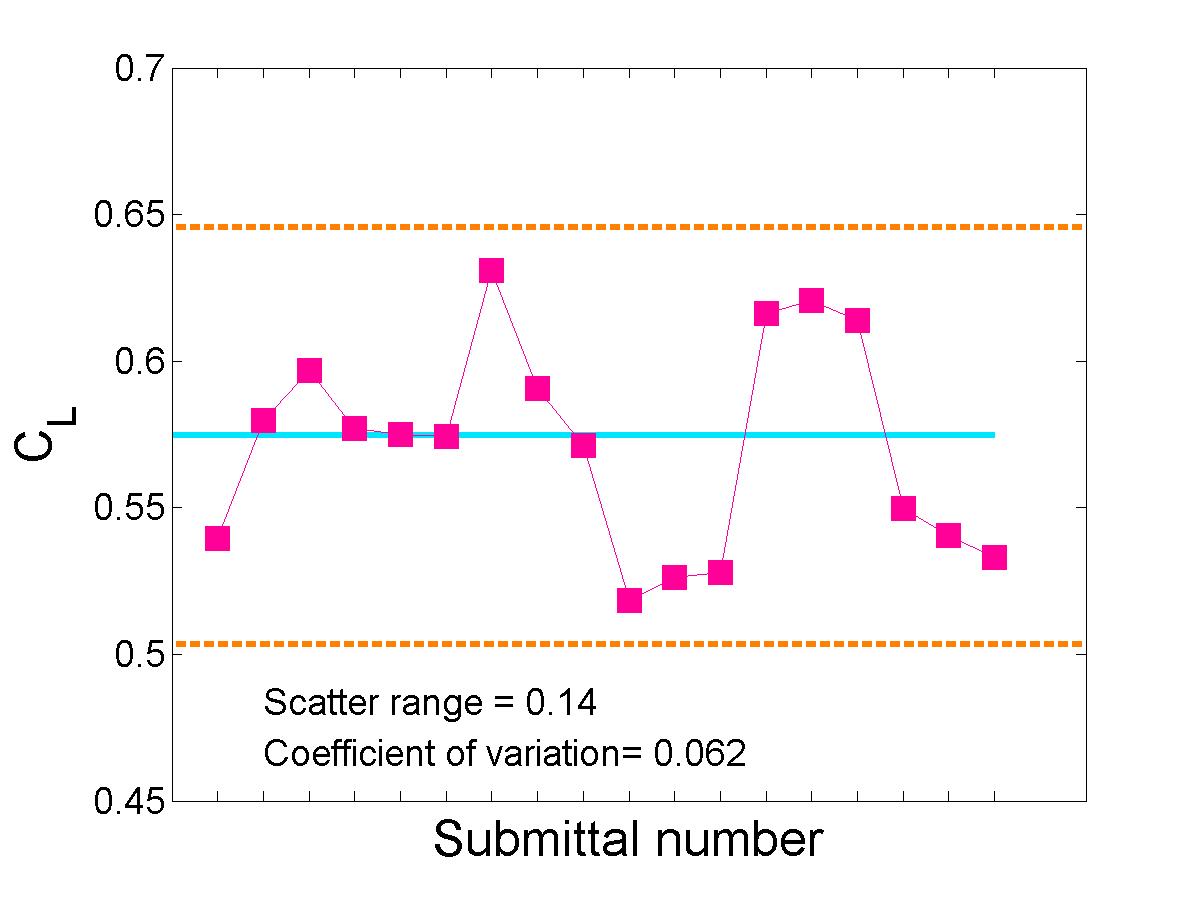
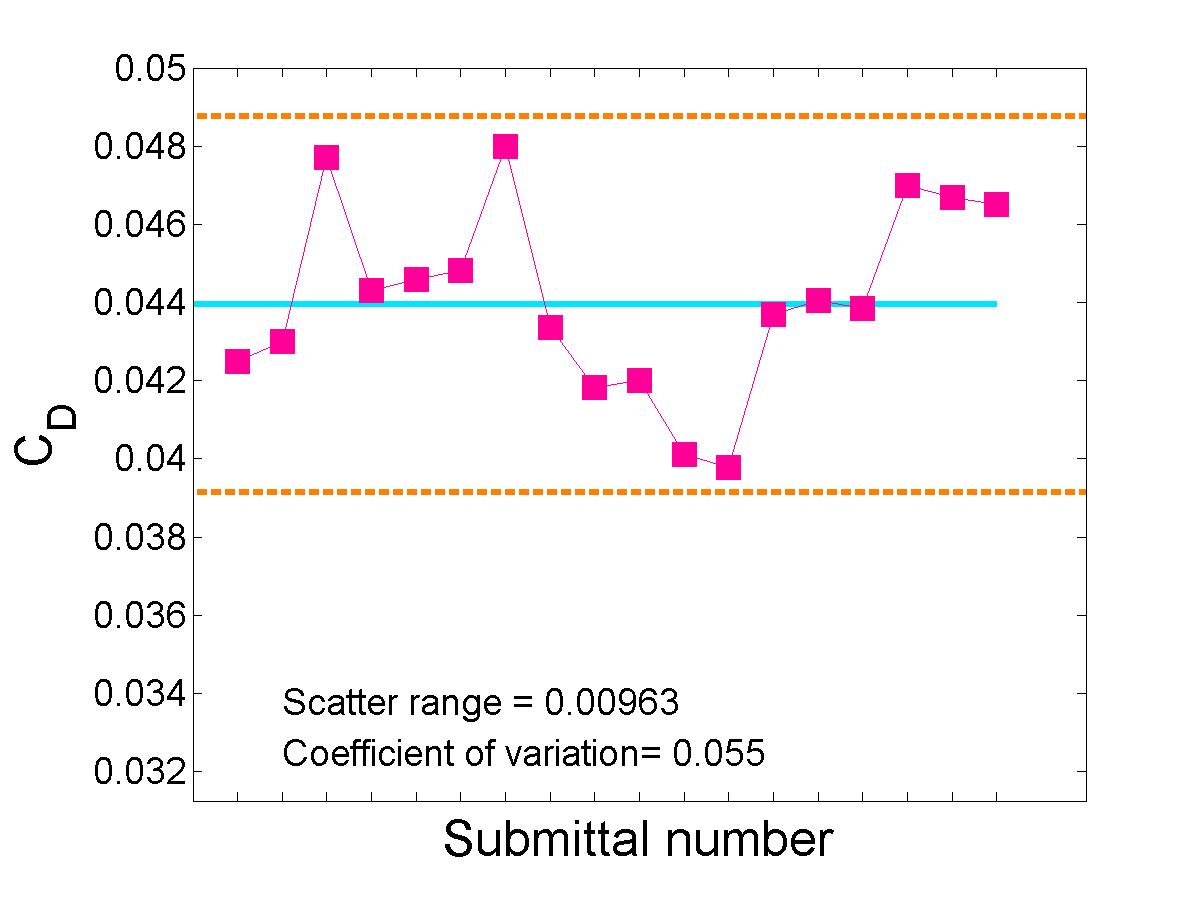
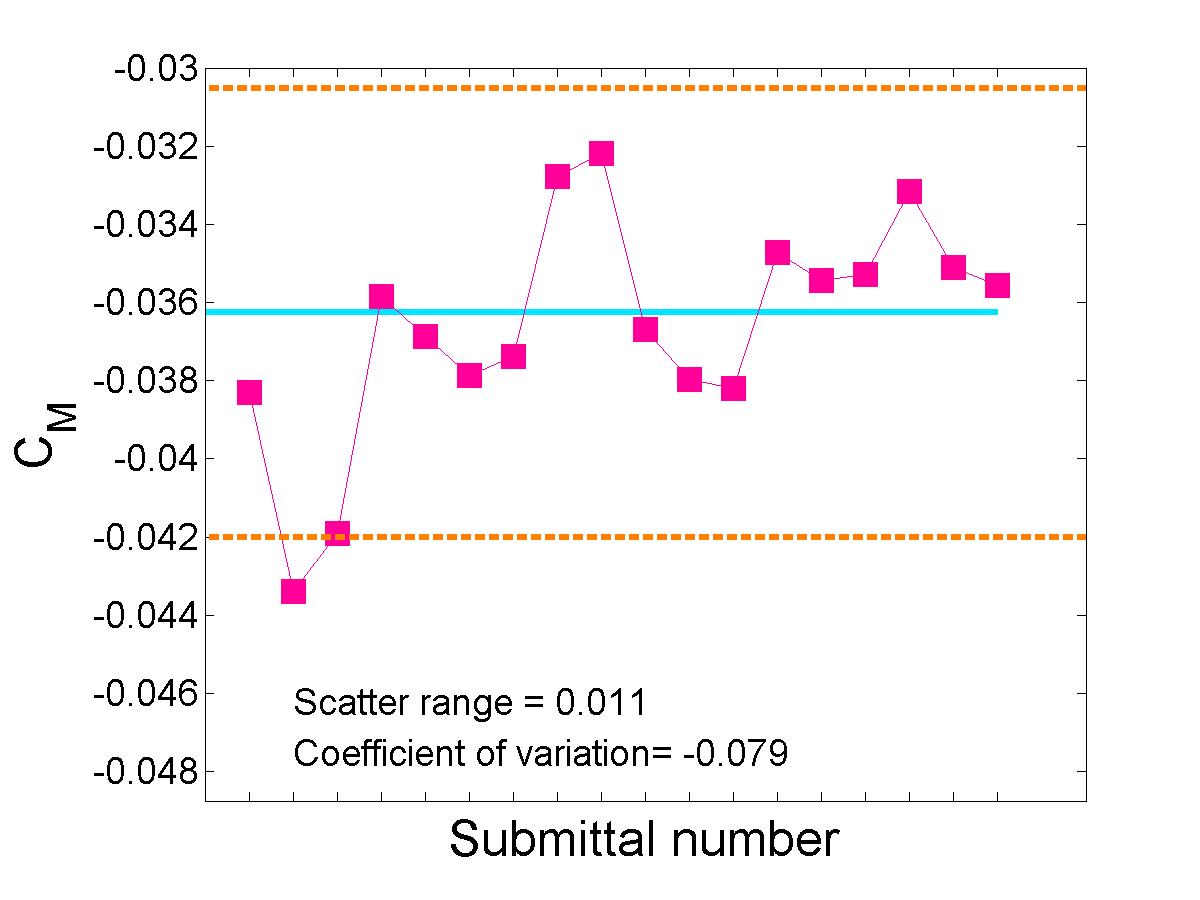
Statistical Analysis of Integrated Coefficients
The submitted integrated load coefficient results were statistically analyzed using the methods applied to the Drag Prediction Workshop (DPW) data and the High Lift Prediction Workshop (HiLPW) data.|
Lift Coefficient |
Drag Coefficient |
Pitching Moment Coefficient |
|
|
|
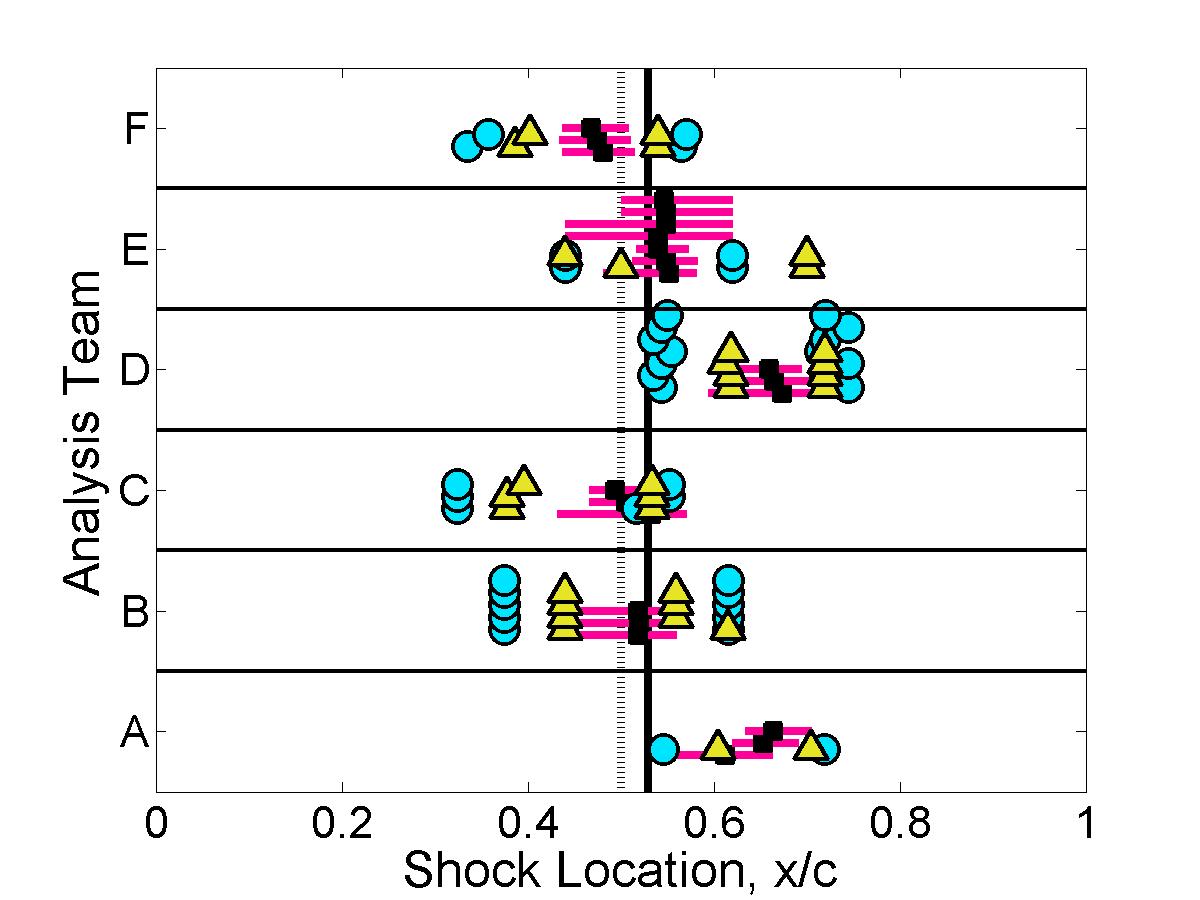
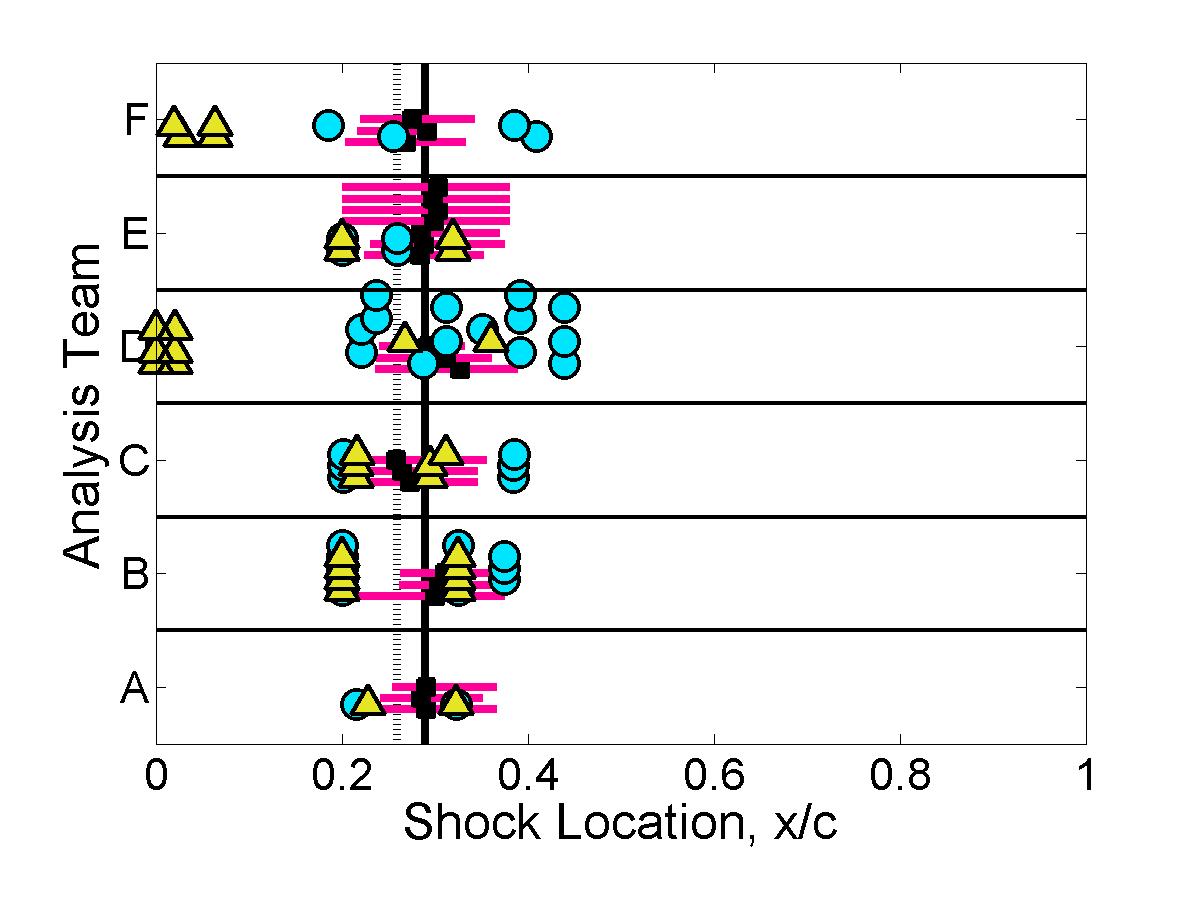
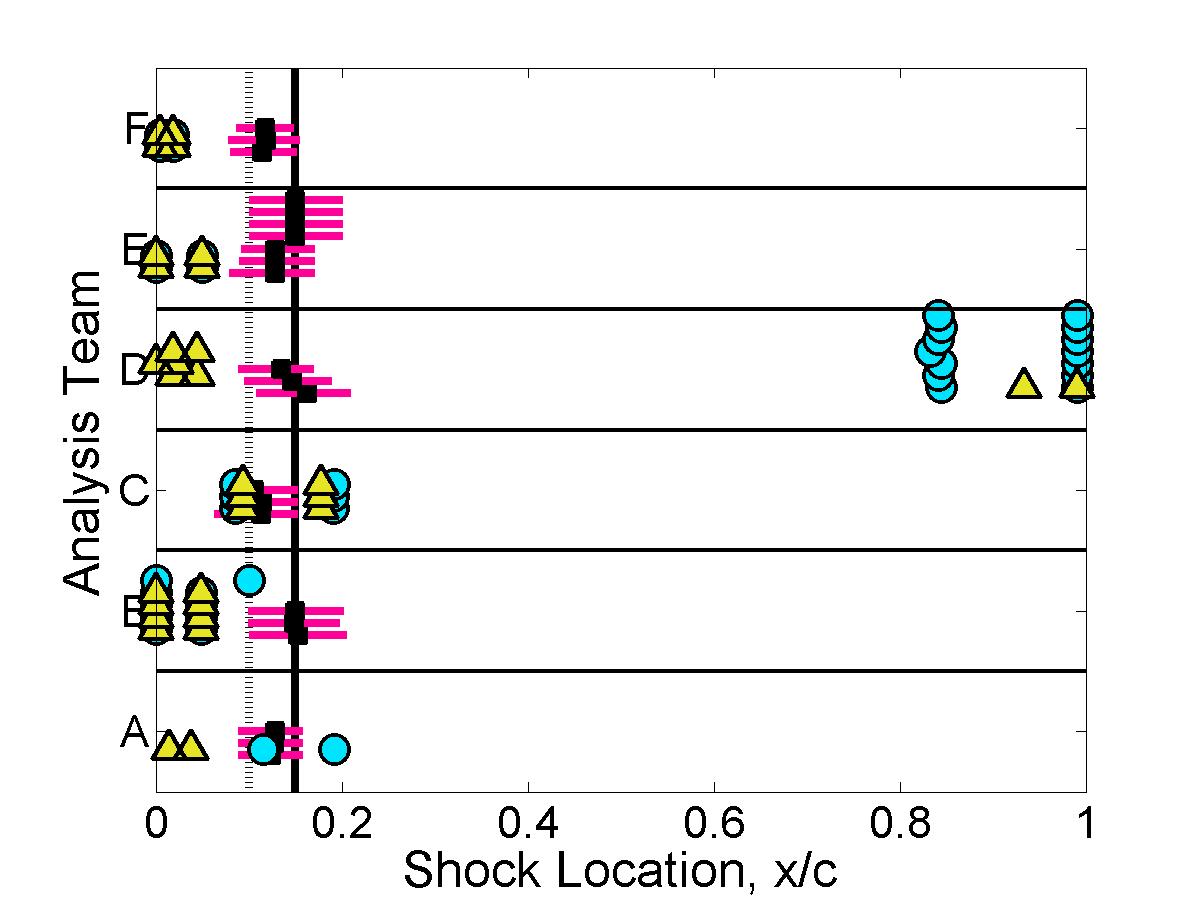
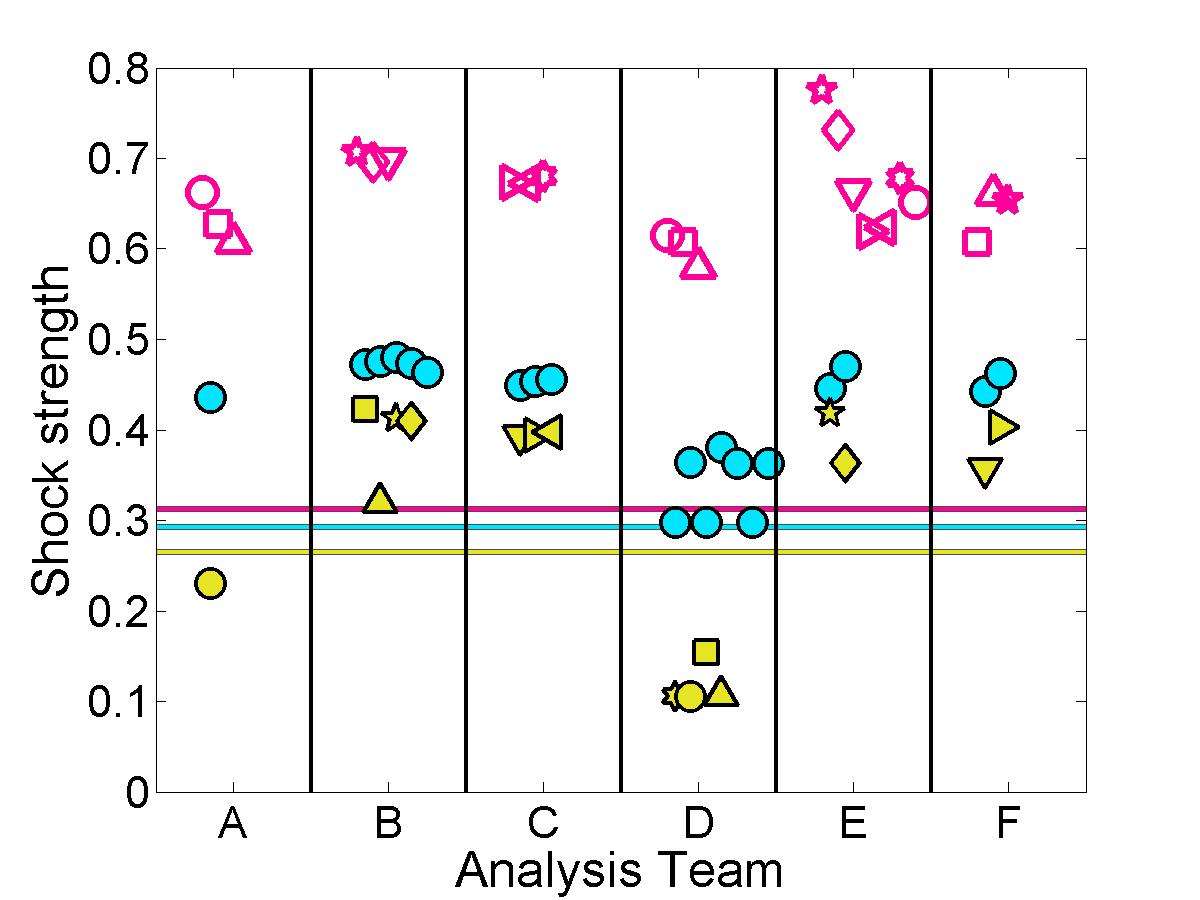
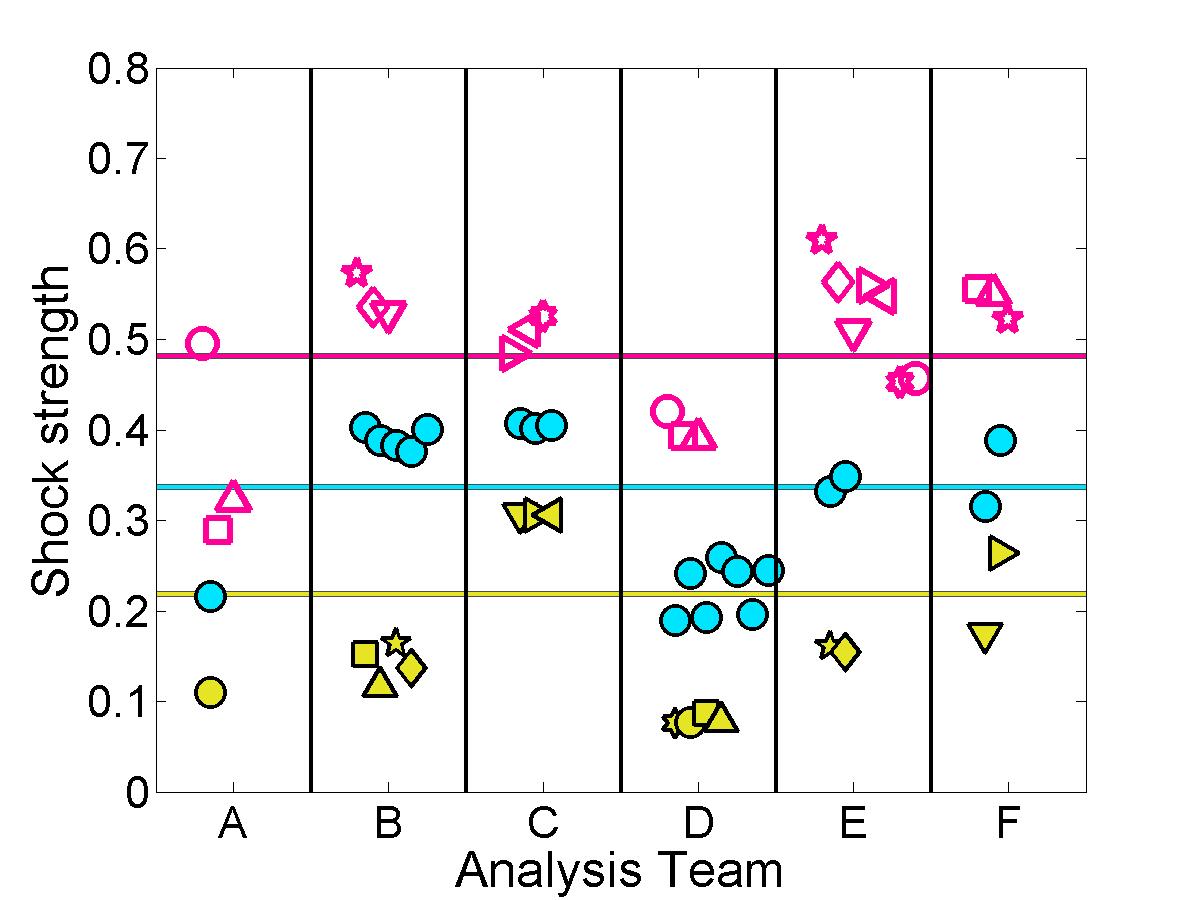
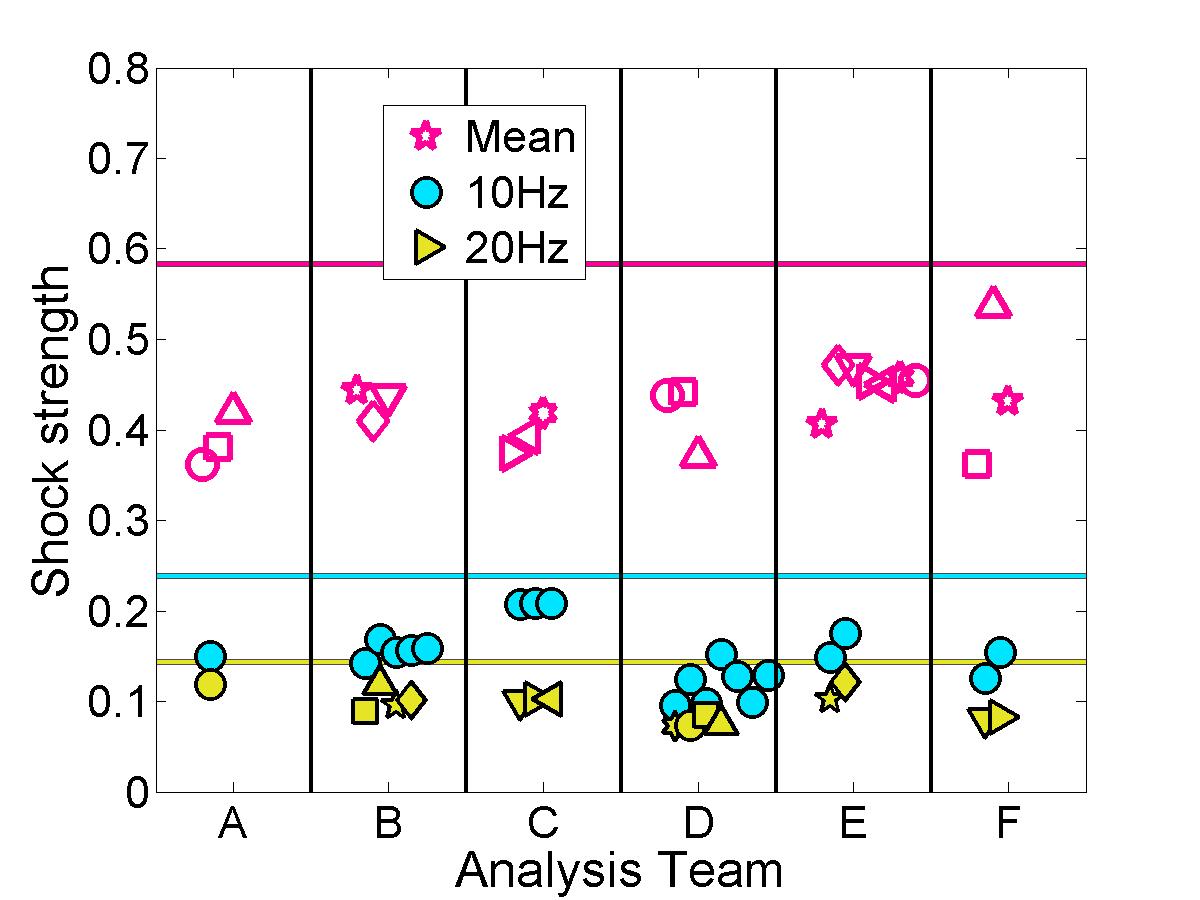
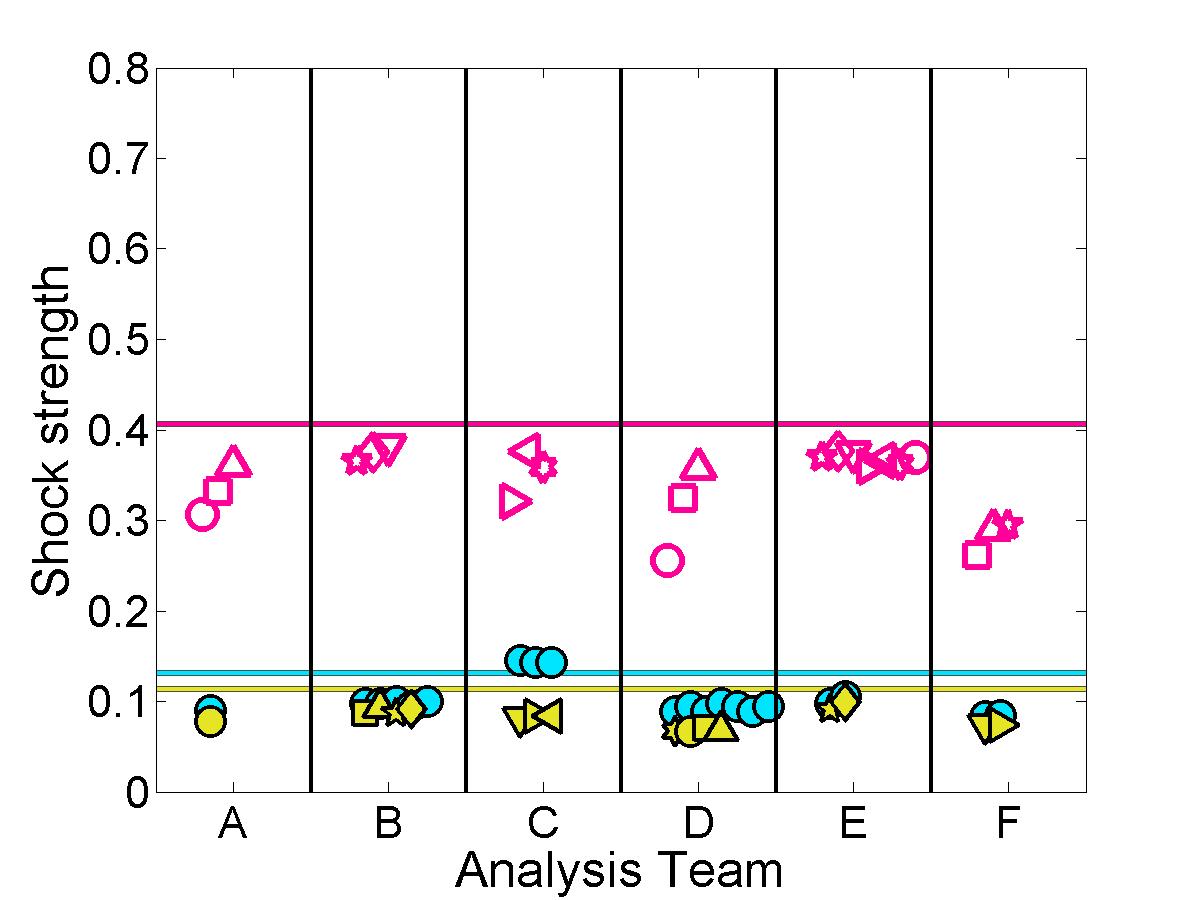
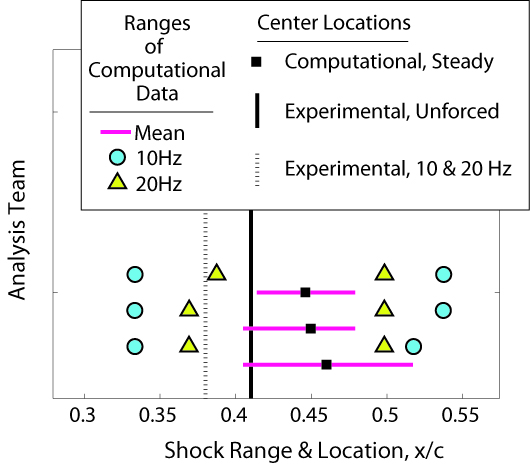
Shock properties
The submitted pressure coefficient results were further analyzed to quantify the predicted shock location & strength for each case.
|
|